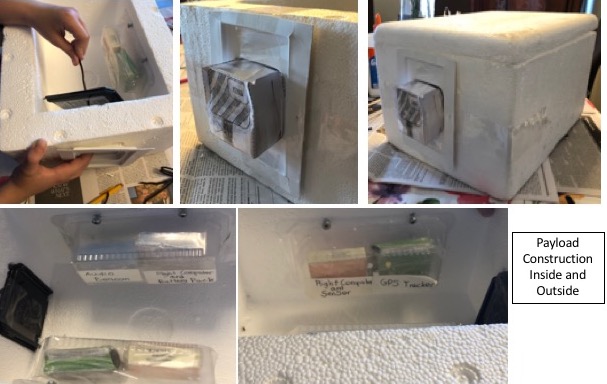
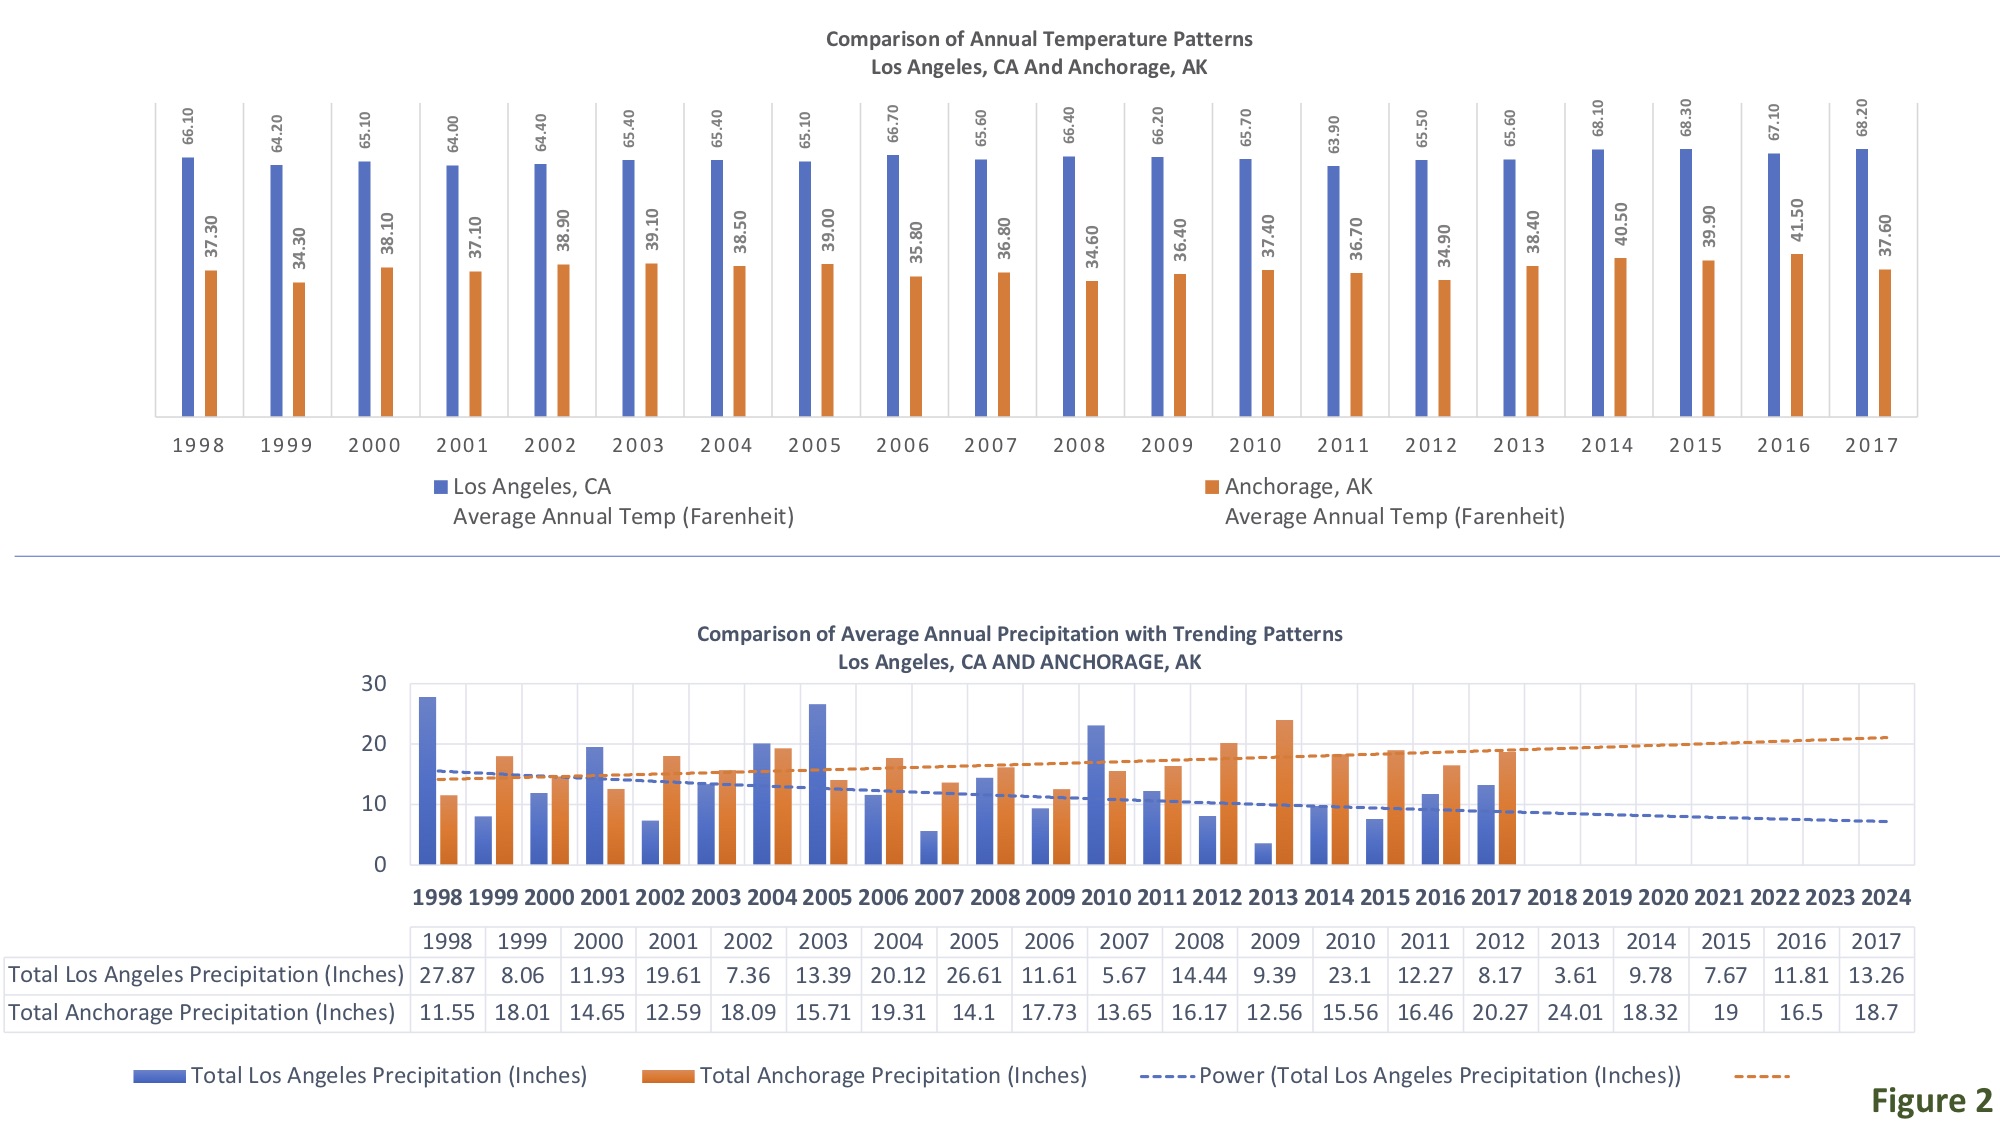
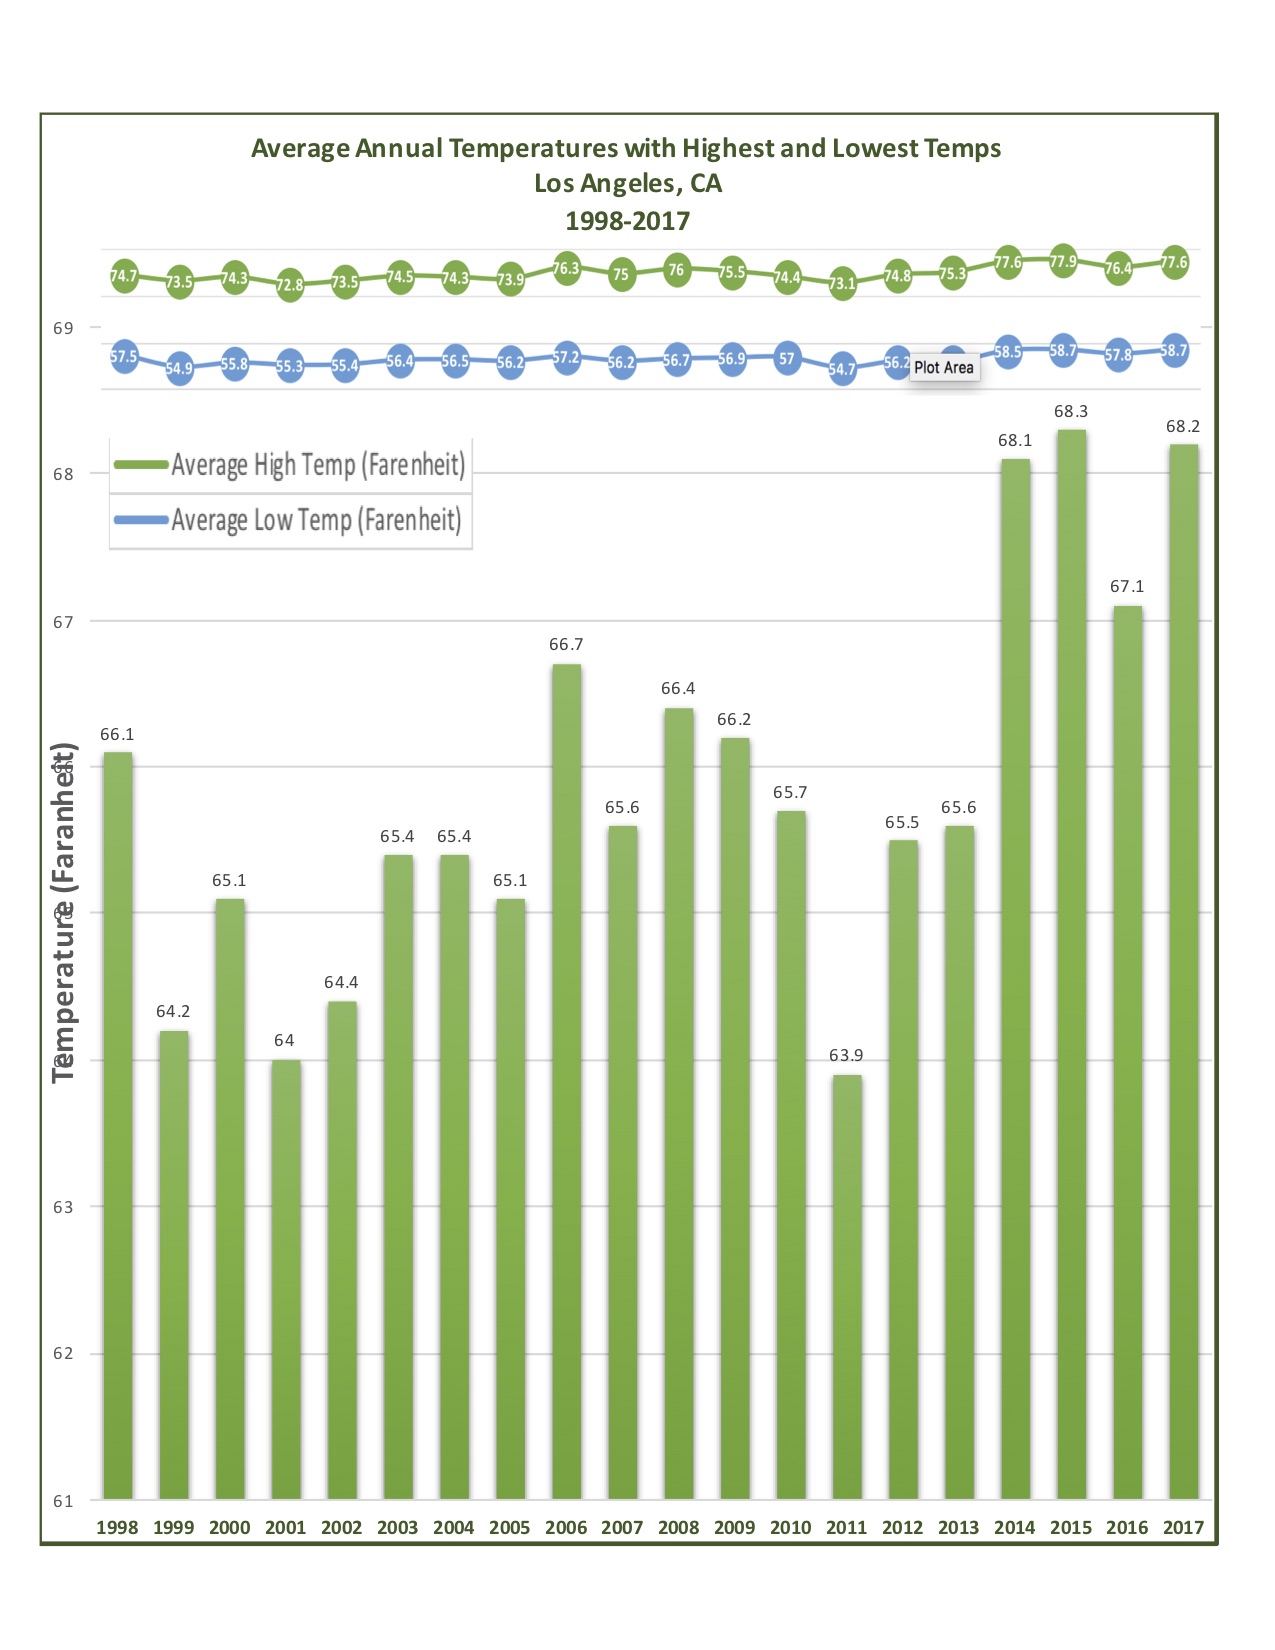
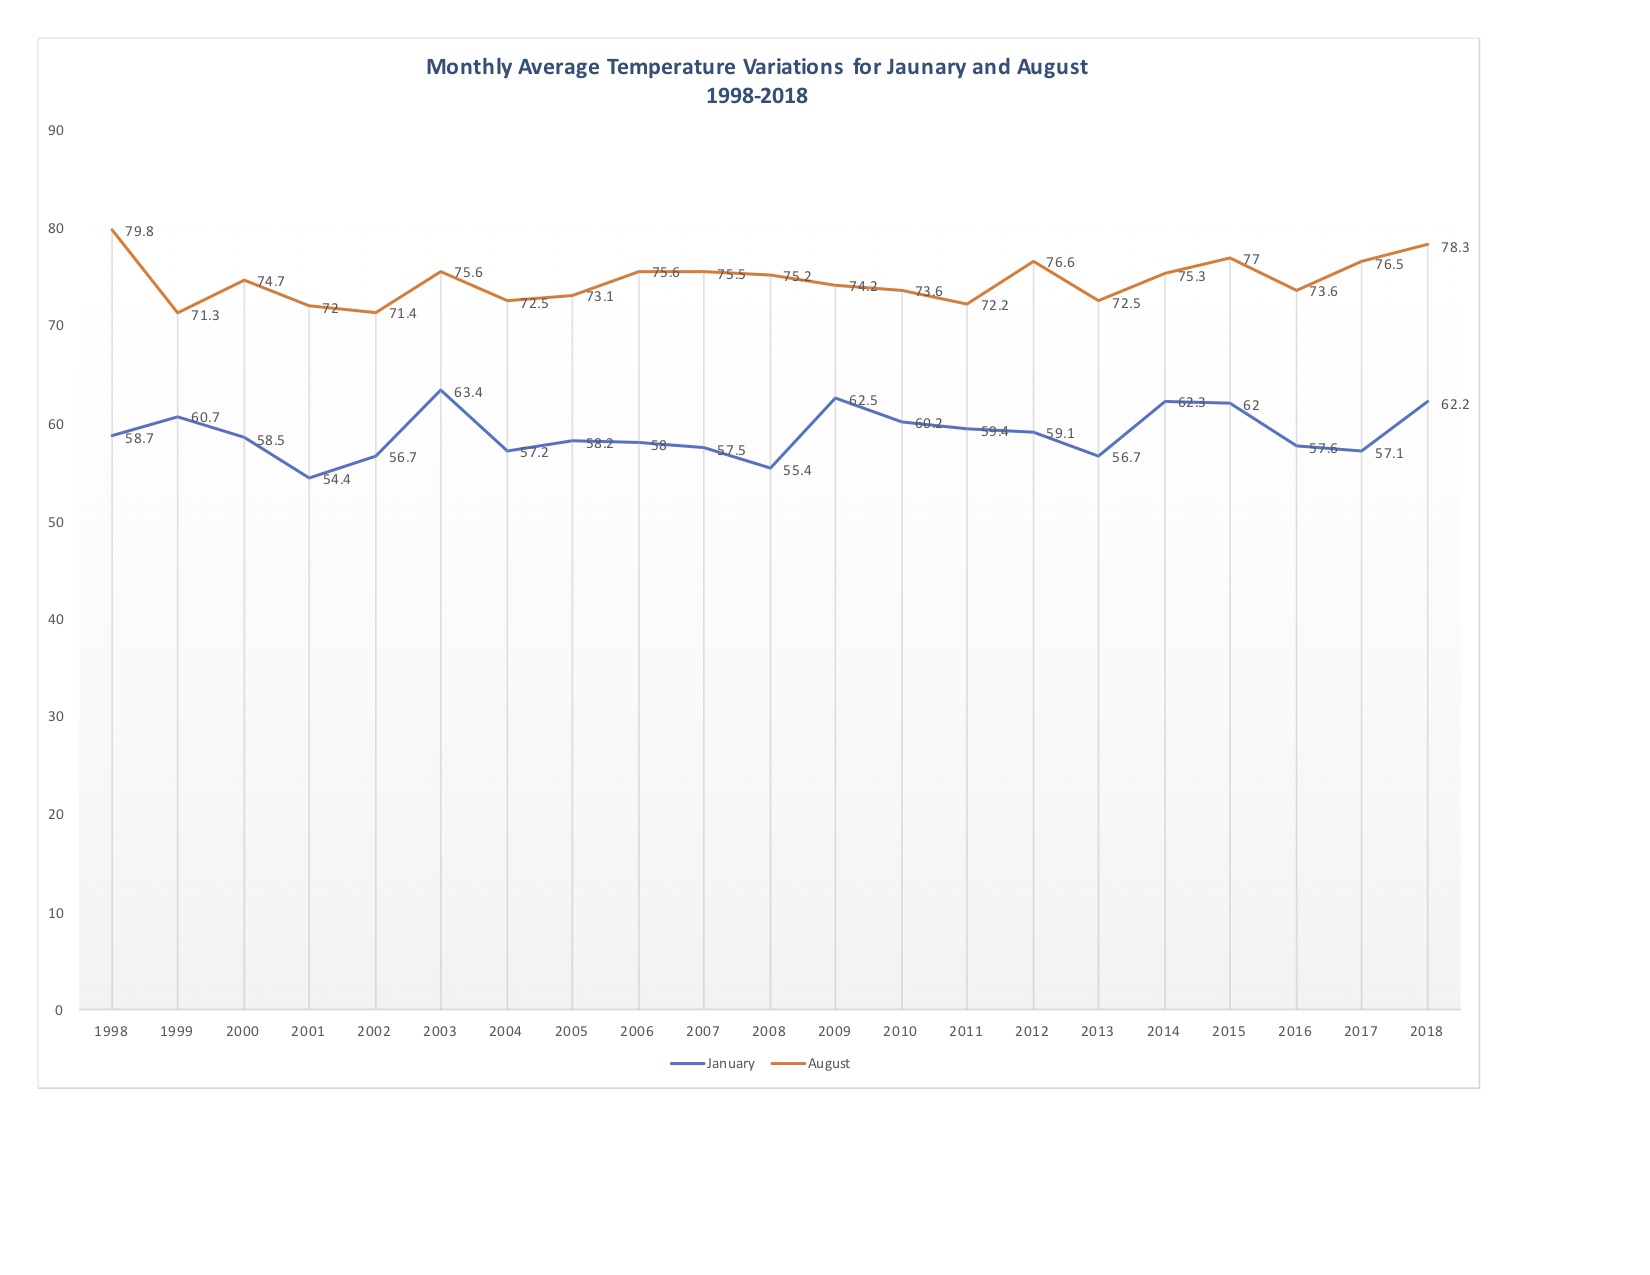
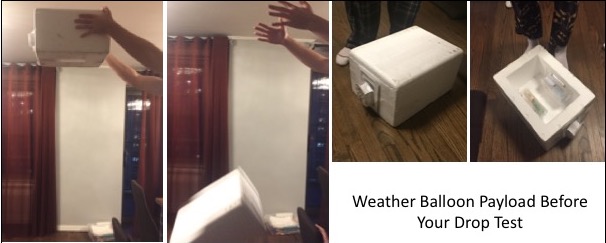
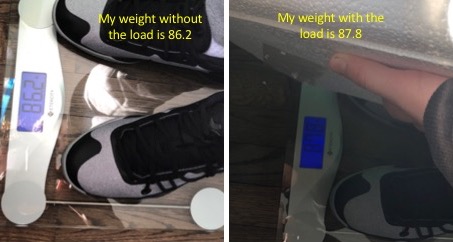
I. DATA ANALYSIS 1. Precipitation Data LA No general pattern; Highest: 27.87(1998)/Lowest: 3.61(2013) Pattern shows spikes during certain years but then goes down. I predict that the precipitation will not go above 23 in the next few years, but will slowly decrease Anchorage Not that much change throughout chart. Small pattern of going up and down but stays mostly the same. Highest: 24.01(2013)/Lowest: 11.55(1998) I predict precipitation level may start to come down for about five years and then go back up (continues pattern). LA vs Anchorage Anchorage had a higher precipitation rate most of the time. L.A. had more spikes and bigger changes. When Anchorage had its lowest rate, L.A. had its higher rate and vise-versa. Overall, both had same pattern of going up and down 2. La Average Temps Monthly: Doesn’t show much variation; Highest -August:79.8; Lowest - January:54.4º. Both months didn’t change as much and mostly stayed on the same level. Annual: Minor changes Highest change is by 2º (not too much) Lowest temp 63.90º Highest temp 68.20º II. PAYLOAD: While doing the design, I had some problems that were later resolved. For my first design, I though the weight was too big, so I used a Styrofoam box of lighter weight (1.3 lb.) I cut open window for the camera and used cheese boxes to keep other devices affixed to the sides of the box with anchored screws to withstand the fall. The fall test worked – devices stayed in their original state.
Contact us
Thank you for your interest in contacting Future Engineers. We look forward to connecting with you!
General Inquiries
support@futureengineers.orgSponsorship Inquiries
sponsor@futureengineers.org